

Overview
The New Meridian Mastery Statistics dataset uses learning components
entities and
relationships.
Use cases
Mastery thresholds work best for decisions about content (e.g., what order to teach standards and learning components in). Decisions about individual students require student data on the same scale and mastery thresholds that pass the required checks.Schema
The data attaches mastery thresholds to existing learning components and standards using thehasMasteryThreshold relationship.
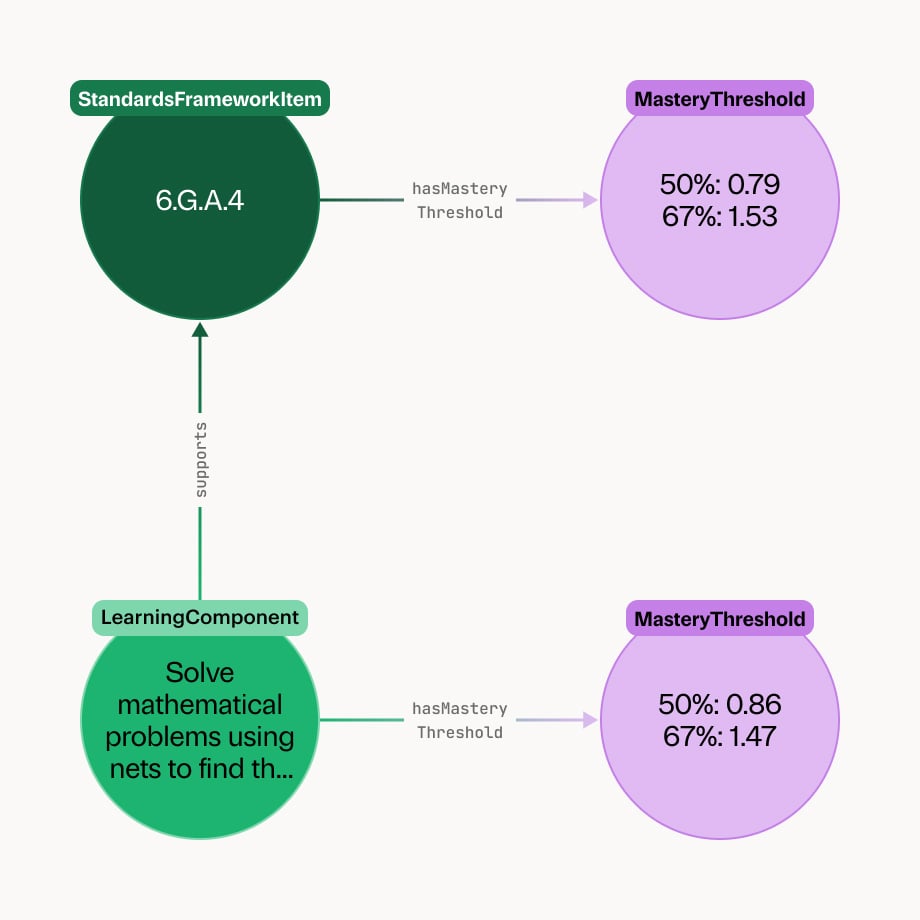
Accessing the data
- Local files
- REST API
- MCP server
Download the dataset:
- From the Dataset catalog: New Meridian Mastery Statistics ↗
- Using direct links or
curl
Mastery thresholds
Theta scale
The dataset scores students, learning components, and standards on the same θ (theta) scale, which follows a bell curve from -4.5 to 4.5 (average 0, standard deviation 1):- For students - Student’s overall math proficiency in their grade
- For learning components and standards - Minimum threshold a student must have before being expected to master the learning component or standard
Students are often stronger in some areas than others. A student’s result on a specific learning component or standard can differ from what their θ predicts. Treat student thresholds as “expected to master,” not “has mastered”.
Cutoffs
The dataset contains mastery thresholds at 2 cutoffs:Using with student data
Leave room for student measurement error.A student whose θ or percentage score sits close to a threshold could be on either side of it. Classify a student as having mastered a learning component or standard only if their estimate clears the threshold by its margin of error, and as not mastered only if it falls below by that margin. Otherwise report that there is not enough evidence.If you do not have a standard error for the student’s θ, ±0.3 is a reasonable default.
Calibrated items
- Items aligned to a specific learning component or standard
- Items drawn from or psychometrically linked to the New Meridian Summative item bank – Released SBAC items are on a different scale and do not qualify
- 3+ items on your own form, and more when several learning components support it (~3 per supporting learning component) - This is separate from the dataset’s
alignedItemCount.
Linked summative scores
To convert scale scores to θ, you need:- Summative test with documented scale score properties
- Sample of your data that approximates the 2015 calibration sample
X- Student’s scale scoreM_X,w- Weighted mean of scale scores in your sampleS_X,w- Standard deviation of scale scores in your sampleM_θ,w- Weighted mean ofθ_sampleS_θ,w- Standard deviation ofθ_sampleμ_2015- 0σ_2015- 1
- This is concordance, not equating. Converted scores match on average, not for each student.
- The conversion does not carry the student’s measurement error. Students near a threshold may fall on either side of it.
- If your test’s content differs a lot from PARCC math, weighting your sample will not fix that. Treat the converted θ as a rough anchor.
Checks
- Student’s grade must match the threshold’s grade band
- Thresholds are grade-specific – there is no scale linking grades
- Threshold should not be off-scale (i.e. exactly 4.5 or −4.5)
- More common in the high school band
- If off-scale, use thresholds for ordering only (no student classification) at the end of the list
- Threshold should be stable and reliable
- Thresholds with
alignedItemCount>= 3 are stable - Thresholds with
reliability50orreliability67>= 0.80 are reliable - 27-40% of learning components and 5-15% of standards do not meet these 2 requirements, depending on the grade band and cutoff
- If these 2 requirements are not met, use thresholds for ordering only (no student classification) at the end of the list
- Thresholds with
alignedItemCount and reliability50 / reliability67 are related but not
interchangeable. Check both properties before using a threshold.Dataset release history
Related topics
Learning components schema reference
Review property definitions for
MasteryThreshold.Math learning components dataset
Thresholds attach to learning components in this dataset.
U.S. academic standards dataset
Standard thresholds attach to Common Core Math standards in this dataset.